

⚡ Direct Answer: How Much Do Solar Panels Cost in 2026?
In 2026, the average cost to install solar panels on a home in the United States is $2.85 to $3.25 per watt. For an average-sized American single-family home requiring an 8 kW system (generating ~950–1,100 kWh per month), the average gross turnkey installation price is $24,000.
The 30% federal credit ended December 31, 2025, so the net out-of-pocket investment stays at $24,000 in 2026. Adding a 13.5 kWh home battery (such as a Tesla Powerwall 3 or Enphase IQ Battery 5P) adds $10,500–$14,000 gross, with no federal offset available for 2026 homeowner installs.
Understanding the true cost of solar panels in 2026 requires looking beyond equipment sticker prices. Between regional utility rate differences, local net billing policies (such as California's NEM 3.0), hardware brand tiers, and state incentives and net billing policies, your actual investment and payback timeline depend on how these factors interact.
1. Residential Solar System Cost by Size & Home Square Footage (2026)
Solar system sizing is determined by your household's annual kilowatt-hour (kWh) electricity consumption rather than just the physical square footage of your roof. However, larger homes generally require larger systems to offset high air conditioning, EV charging, and heat pump loads. The matrix below outlines gross pricing, 2026 federal credit status, net investment, and typical home size matches (all 2026 figures reflect post-credit economics):
| System Size (kW) | Number of 400W Panels | Est. Monthly Output | Gross Price ($3.00/W) | Federal Credit (2026) | Net Turnkey Cost | Typical Home Size |
|---|---|---|---|---|---|---|
| 5 kW | 12–13 Panels | ~625 kWh | $15,000 | $0 | $15,000 | 1,000–1,400 sq ft |
| 6 kW | 15 Panels | ~750 kWh | $18,000 | $0 | $18,000 | 1,400–1,800 sq ft |
| 8 kW (US Avg) | 20 Panels | ~1,000 kWh | $24,000 | $0 | $24,000 | 1,800–2,400 sq ft |
| 10 kW | 25 Panels | ~1,250 kWh | $30,000 | $0 | $30,000 | 2,400–3,200 sq ft (+EV) |
| 12 kW | 30 Panels | ~1,500 kWh | $36,000 | $0 | $36,000 | 3,200+ sq ft / High AC |
| 15 kW | 37–38 Panels | ~1,875 kWh | $43,500 | $0 | $43,500 | Estate / Dual EV / Pool |
2. Turnkey Cost Architecture: Where Does Your Money Actually Go?
A common misconception is that solar panels account for the bulk of your installation invoice. In reality, physical photovoltaic modules represent only roughly one-fourth (25%) of your total gross contract price. The remainder is divided between electrical power electronics, installation labor, and installer "soft costs."
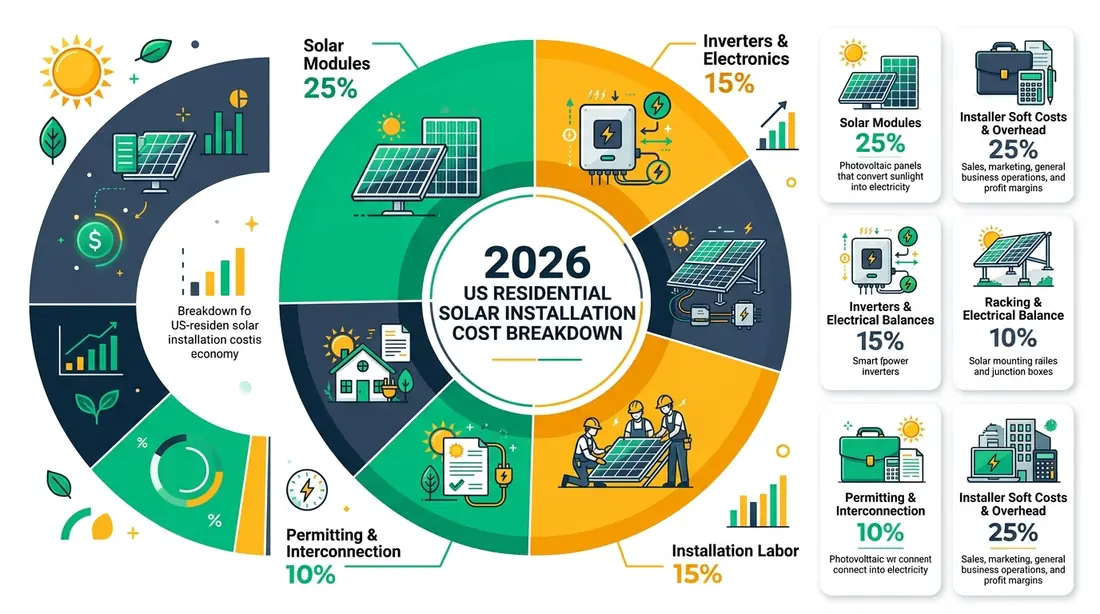
The 2026 Turnkey Cost Architecture: Hardware accounts for only 50% of your total price, with soft costs and labor comprising the other half.
- Photovoltaic Solar Modules (25%): The physical panels mounted on your roof (e.g., Tier-1 brands like REC Alpha Pure, Qcells Q.PEAK DUO, Canadian Solar, or Panasonic EverVolt). High-efficiency N-type TOPCon panels cost 10–15% more than older P-type PERC cells but deliver superior temperature coefficients in hot climates.
- Inverters & Power Optimizers (15%): The hardware that converts direct current (DC) generated by panels into alternating current (AC) used by home appliances. Enphase IQ8 microinverters offer module-level optimization and rapid shutdown compliance, while SolarEdge DC optimizers and string inverters offer an efficient centralized alternative.
- Racking, Wiring & Electrical Balance of System (10%): Anodized aluminum roof rails, flashing, lag bolts, conduit, junction boxes, and AC/DC disconnect safety switches.
- Direct On-Site Installation Labor (15%): Licensed journeyman electricians, certified NABCEP roof installers, and staging crews.
- Municipal Permitting, Utility Interconnection & Engineering (10%): Structural roof load engineering stamps, City Department of Building & Safety permits, and local utility Permission to Operate (PTO) interconnection fees.
- Installer Soft Costs, Sales, & Margin (25%): Customer acquisition marketing, administrative overhead, site surveys, fleet maintenance, and company warranty reserves.
3. State-by-State Solar Price Per Watt & Payback Index (Top 10 States)
Electricity costs and net metering policies vary dramatically across the United States. In states with high retail electric rates (such as California, New York, and Massachusetts), solar pays for itself in 4 to 7 years. In lower-cost electricity markets, payback periods stretch to 8 to 11 years.
| State | Avg Cost / Watt | Avg 8kW Net Cost | Avg Electric Rate | Net Metering Status | Avg Payback Period |
|---|---|---|---|---|---|
| California | $2.95 / W | $16,520 | $0.33 – $0.48 / kWh | NEM 3.0 (Net Billing) | 6.0 – 7.5 Years (w/ Battery) |
| Texas | $2.75 / W | $15,400 | $0.14 – $0.18 / kWh | Deregulated Buyback Plans | 7.5 – 9.0 Years |
| Florida | $2.65 / W | $14,840 | $0.15 – $0.17 / kWh | Full 1-to-1 Net Metering (FPL, Duke) | 7.8 – 9.2 Years |
| New York | $3.25 / W | $13,200 (w/ NY-Sun) | $0.24 – $0.32 / kWh | VDER & Net Metering | 5.0 – 6.5 Years |
| Arizona | $2.70 / W | $15,120 | $0.14 – $0.17 / kWh | Resource Comparison Proxy (RCP) | 7.0 – 8.5 Years |
| New Jersey | $2.90 / W | $16,240 | $0.18 – $0.22 / kWh | SuSI SREC-II Incentive ($85/MWh) | 4.8 – 6.0 Years |
| Massachusetts | $3.40 / W | $19,040 | $0.28 – $0.34 / kWh | SMART Program Production Declines | 4.5 – 5.8 Years |
| Pennsylvania | $3.10 / W | $17,360 | $0.17 – $0.19 / kWh | 1-to-1 Net Metering (PECO, PPL) | 8.0 – 9.5 Years |
| Georgia | $2.80 / W | $15,680 | $0.13 – $0.16 / kWh | Avoided Cost Net Billing (Georgia Power) | 9.5 – 11.5 Years |
| North Carolina | $2.70 / W | $15,120 | $0.13 – $0.15 / kWh | Duke Energy Solar Choice Net Metering | 8.5 – 10.0 Years |
4. Financing Methods Compared: Cash vs. Solar Loan vs. Lease/PPA
How you pay for solar has a greater impact on your lifetime return on investment than the brand of solar panels you choose. While third-party leases and Power Purchase Agreements (PPAs) market "$0 down" installations, they carry significant trade-offs regarding home sale complications and forfeited tax incentives.
| Financial Metric | Direct Cash Purchase | Solar Loan (Ownership) | Solar Lease / PPA |
|---|---|---|---|
| Upfront Cost | 100% Out-of-Pocket ($24k net) | $0 Down Available | $0 Down Standard |
| Who Gets a Federal Tax Credit? | Nobody in 2026 (credit ended) | Nobody in 2026 (credit ended) | Leasing company (Section 48E, if eligible) |
| Est. 25-Year Net Savings | $35,000 – $65,000+ | $20,000 – $40,000 | $8,000 – $18,000 |
| Hidden "Dealer Fees" | None ($0) | 15% to 30% on low-APR loans | Annual Escalators (1.9%–3.5%/yr) |
| Impact on Selling House | Adds 4.1% property value (Zillow) | Payoff at escrow or transfer loan | Buyer must qualify and assume contract |
⚠️ Beware the "Low APR" Solar Loan Dealer Fee Trap
If an installer offers a 25-year solar loan at an enticing 3.99% or 4.99% interest rate when federal interest rates are higher, the financing partner is charging a hidden dealer origination fee of 20% to 32% added onto the cash price. For example, a $24,000 cash system is marked up to $31,000 on paper. Always ask your installer: "What is the total cash purchase price if I write a check today?"
5. Solar Plus Battery Storage: How Much Does a Home Battery Cost?
With the rapid expansion of Time-of-Use (TOU) utility rates and Net Billing policies across the country, pairing solar panels with residential battery storage has transitioned from an emergency luxury to a core financial asset.
- Equipment & Installation Range: Installing a 10 kWh to 13.5 kWh battery storage system costs between $10,500 and $14,500 as an add-on to a solar installation. Standalone battery retrofits on existing solar systems cost approximately $12,000 to $16,000 due to rewiring and permitting.
- Federal Tax Credit Eligibility: The Section 25D credit that covered 3+ kWh standalone batteries ended December 31, 2025 — there is no federal credit for homeowner battery installs in 2026. Budget the full $10,500–$14,500.
- Popular 2026 Residential Batteries:
- Tesla Powerwall 3 (13.5 kWh): Features an integrated 11.5 kW solar inverter, handling up to 20 kW DC of solar panels directly without separate microinverters. Installed cost: ~$11,500–$13,500.
- Enphase IQ Battery 5P (5 kWh modular): Uses safe Lithium Iron Phosphate (LFP) chemistry with a 15-year warranty. A standard dual-unit 10 kWh setup costs ~$11,000–$14,000 installed.
- Generac PWRcell (9–18 kWh): Modular cabinet system with high starting surge power for whole-home central air conditioners. Installed cost: ~$13,000–$17,000.
6. Hidden Installation Costs to Budget For Before Going Solar
When obtaining proposals from local installers, verify whether your home requires preliminary infrastructure upgrades that could add unexpected costs:
- Main Electrical Service Panel Upgrade (MPU): Older homes with 100-amp or 125-amp electrical panels frequently require an upgrade to a 200-amp panel to handle solar backfeed and EV charging breakers. Expected Cost: $1,800 to $3,500 (no federal credit applies to 2026 homeowner installs).
- Roof Condition & Remaining Lifespan: Solar panels are warrantied to produce power for 25 to 30 years. If your asphalt shingle roof is more than 15 years old, replace it before installing solar. Removing and reinstalling panels during a mid-life reroof costs $150–$300 per panel ($3,000–$6,000 for an 8kW system). See our detailed guide on solar panel removal and reinstallation costs.
- Tree Trimming & Obstruction Clearing: Significant shading from mature oak or pine trees can reduce system output by 20–40%. Budget $500–$2,000 for professional arborist pruning.
- Critter Guard Protection: In suburban regions with high squirrel or pigeon populations, installing wire mesh critter guards prevents chewed DC cabling and nesting beneath panels. Expected Cost: $500 to $1,200.
7. 5-Step Formula to Calculate Your Solar Break-Even ROI
To determine exactly when your solar panel system will pay for itself and begin generating pure free electricity, use this proven 5-step formula:
Payback Period (Years) = Net Turnkey System Cost ÷ Annual Electric Bill Savings
Real-World Example (8 kW System in Arizona/Texas):
- Step 1 (Gross Cost): 8,000 Watts × $2.85/Watt = $22,800
- Step 2 (Federal Tax Credit, 2026): $0 — the 30% credit ended December 31, 2025 ➔ Net Cost = $22,800
- Step 3 (Annual Output): 8 kW × 1,450 peak sun hours = 11,600 kWh produced per year
- Step 4 (Annual Utility Savings): 11,600 kWh × $0.16/kWh utility rate = $1,856 saved in Year 1
- Step 5 (Break-Even): $22,800 ÷ $1,856/year = 12.28 Years Payback
After year 12.3, the solar system produces 100% free electricity for the remainder of its 25–30 year lifespan, generating over $31,000 in net lifetime profit as utility electricity rates inflate.
Calculate Your Custom Solar Savings
Want to see exact pricing based on your zip code, roof sunlight hours, and monthly power bill? Use our interactive financial calculators: